Project journal
Business Data Analytics
A group coursework project that turns 142,129 Football Manager player records into scouting, player-comparison, and squad-planning dashboards.
- Where
- Mahidol University · ITCS343
- Project period
- Semester 1, 2025
- My role
- Data preparation and BI dashboard development · Group Wav
Starting with a football decision, not a chart
I worked with two classmates on this ITCS343 Business Data Analytics project. We began with 142,129 player records and 77 columns from the Football Manager 2020 dataset, then asked how that volume of game data could support the kinds of choices a football club needs to make.
We defined two audiences. A scout needs to narrow a large player pool to people who fit a specific role and budget. A director of football needs a broader view of ability, wages, squad age, and the balance of the team. That distinction shaped both the preparation work in Alteryx and the three report pages we built in Power BI.
Five questions behind the analysis
The report frames five scenarios: finding young players with room to develop, identifying experienced players who could mentor a squad, comparing ability with value and wages, finding a replacement with a similar playing profile, and reviewing the balance of an entire team.
These scenarios gave each transformation and visual a reason to exist. Age and PA help with a prospect search. Leadership, determination, and teamwork support a mentor comparison. Position-specific attributes help compare replacements, while team value, weekly wage, average CA, age, and nationality support squad-level planning.
What one player record contains
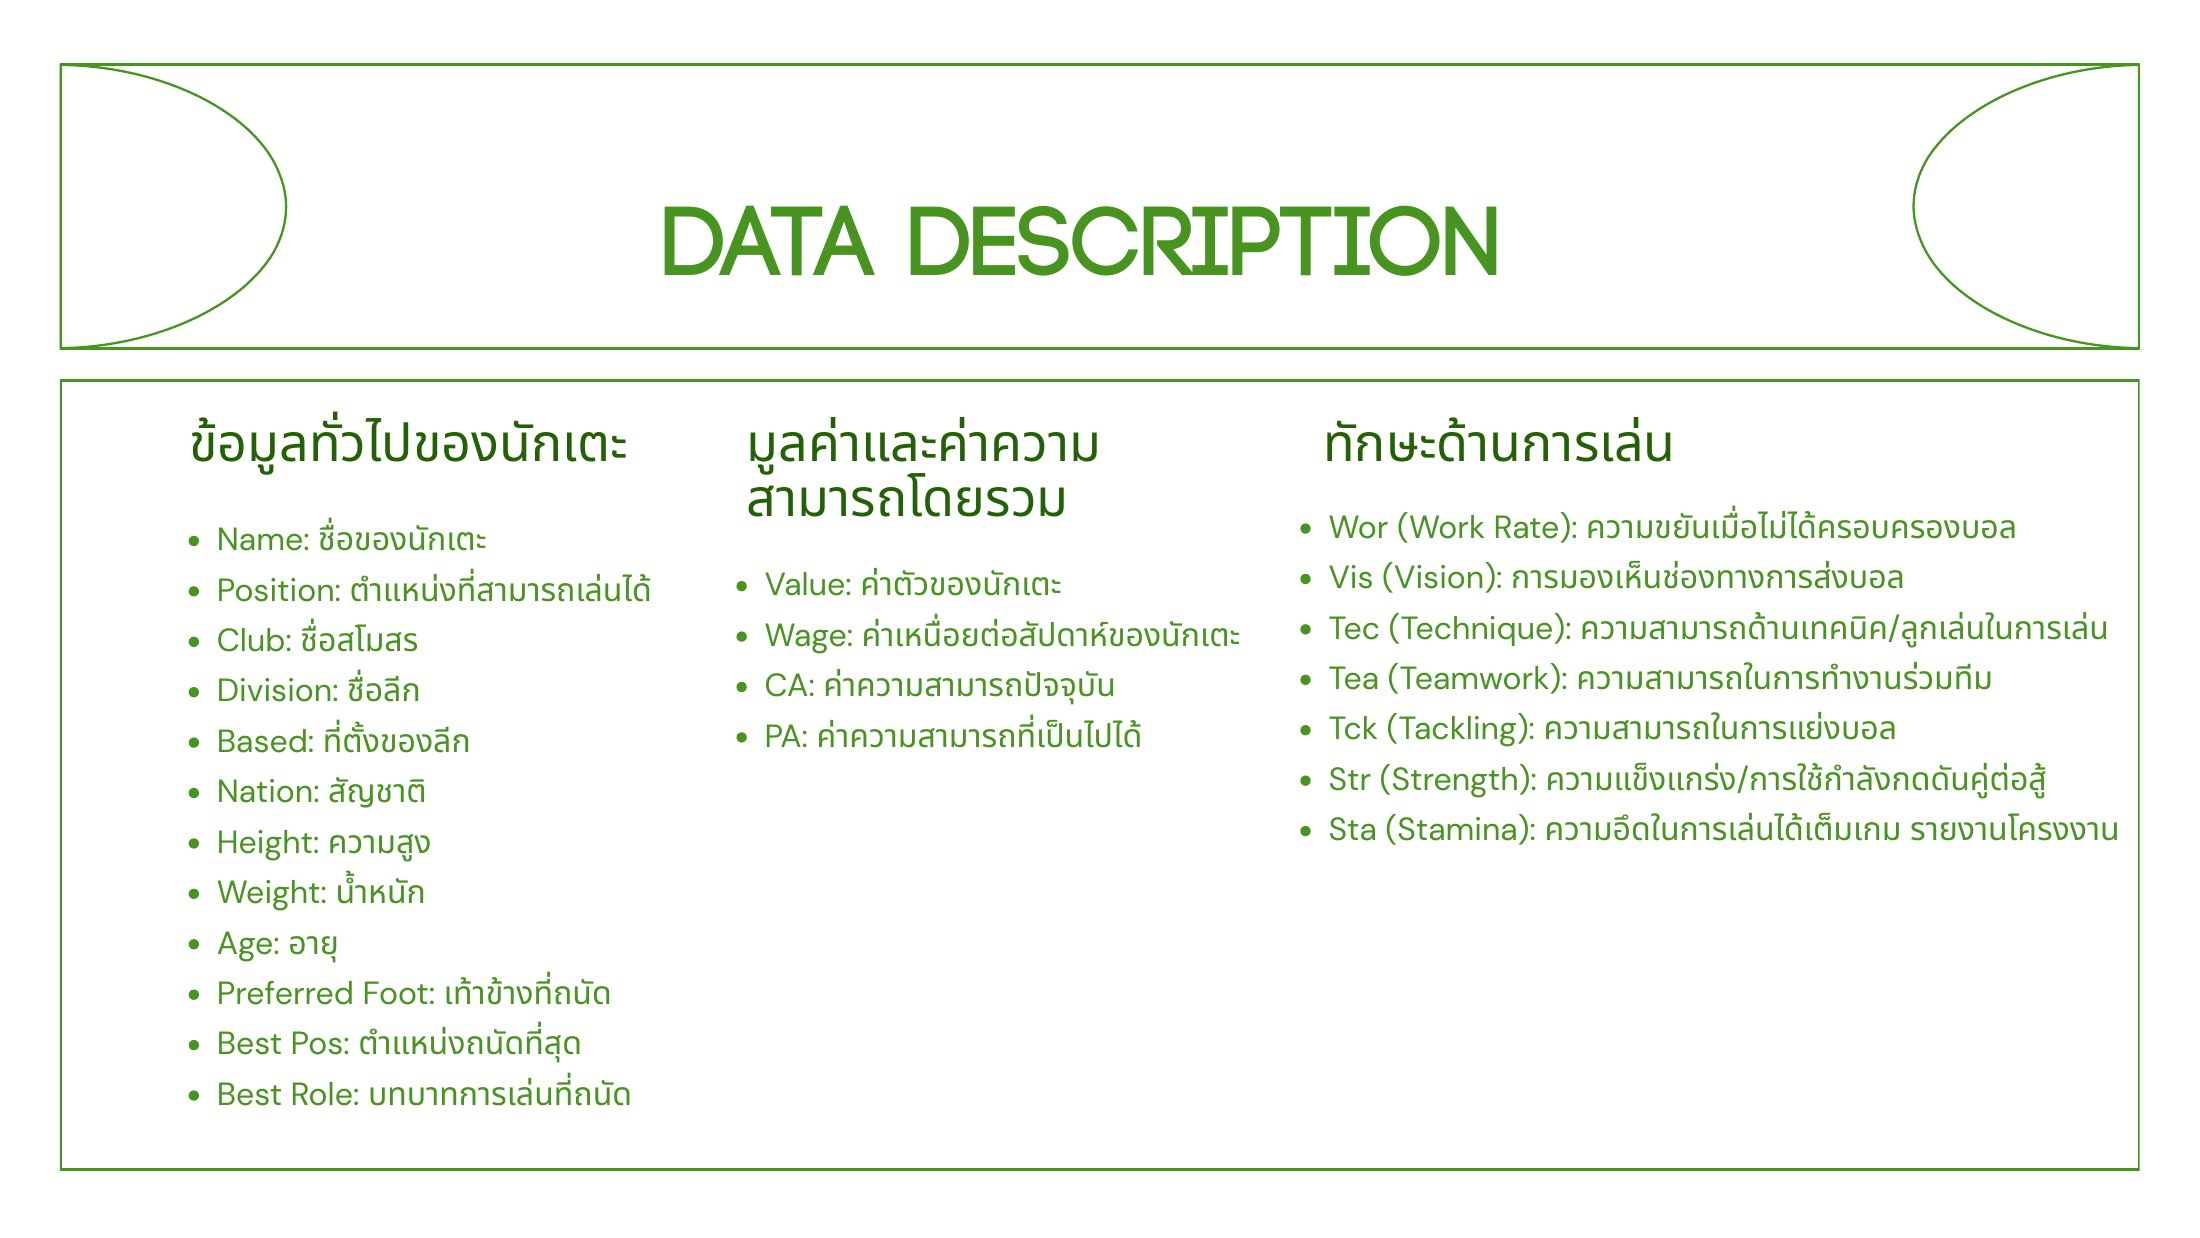
The Kaggle dataset includes identity and context fields such as player name, club, division, nationality, age, preferred foot, position, and role. It also includes financial fields, current ability (CA), potential ability (PA), and detailed technical, mental, physical, and goalkeeping attributes.
Position and role help define a shortlist, value and weekly wage introduce cost, and CA and PA add current-versus-future ability. Because these are Football Manager game ratings, the project is an academic decision-support exercise rather than a prediction of real-world player performance.
The fields behind the scouting questions
The original data-description slide groups the fields into player context, financial and ability measures, and playing attributes.
 View full size ↗
From raw records to an interactive report
Football Manager 2020
Start with 142,129 player records and 77 source fields.
Alteryx
Clean, enrich, score, and reshape the player data for analysis.
Power BI
Explore scouting shortlists, compare players, and review a whole squad.
Cleaning and enriching the data in Alteryx
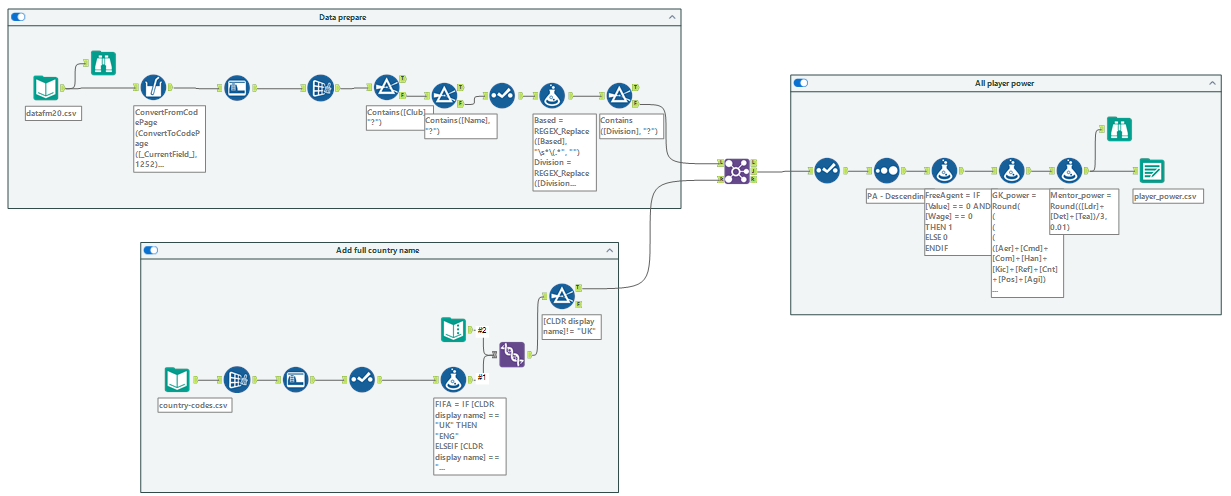
The first part of the workflow repairs encoded text, applies Auto Field and Data Cleansing, filters records that still contain question marks, and removes the bracketed competition detail from the Based and Division fields. A second branch brings in country-code data, keeps the FIFA and CLDR display-name fields, handles special country-code cases, and joins the readable country name back to the player table.
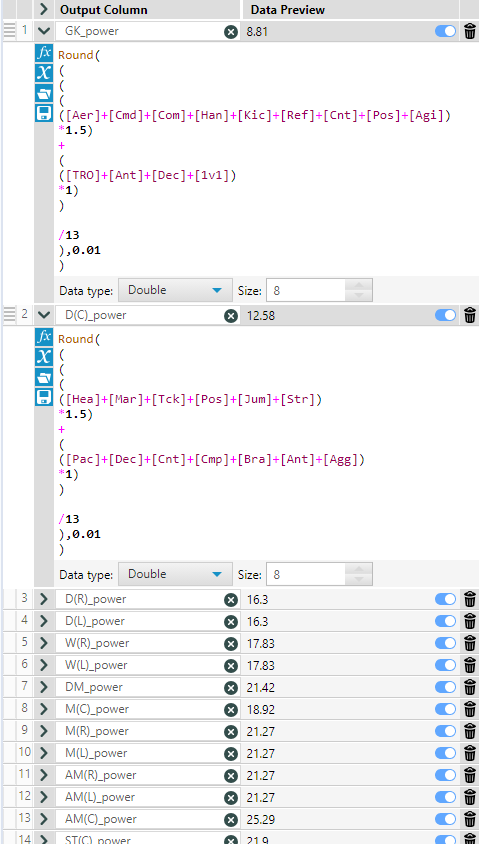
After the join, the workflow sorts by PA and creates fields for reporting. FreeAgent is true when both value and wage are zero. Position-power fields use weighted combinations of the attributes that matter for each role, while Mentor_power averages leadership, determination, and teamwork. The final branch transposes player attributes so Power BI can plot them consistently.
The complete Alteryx workflow
The submitted workflow is divided into data preparation, country-name enrichment, player scoring, and a transposed output for attribute visuals.
 View full size ↗
Making position scores explicit
The formulas keep the scoring logic visible instead of hiding it inside a final chart.
 View full size ↗
Three dashboards for different levels of a decision
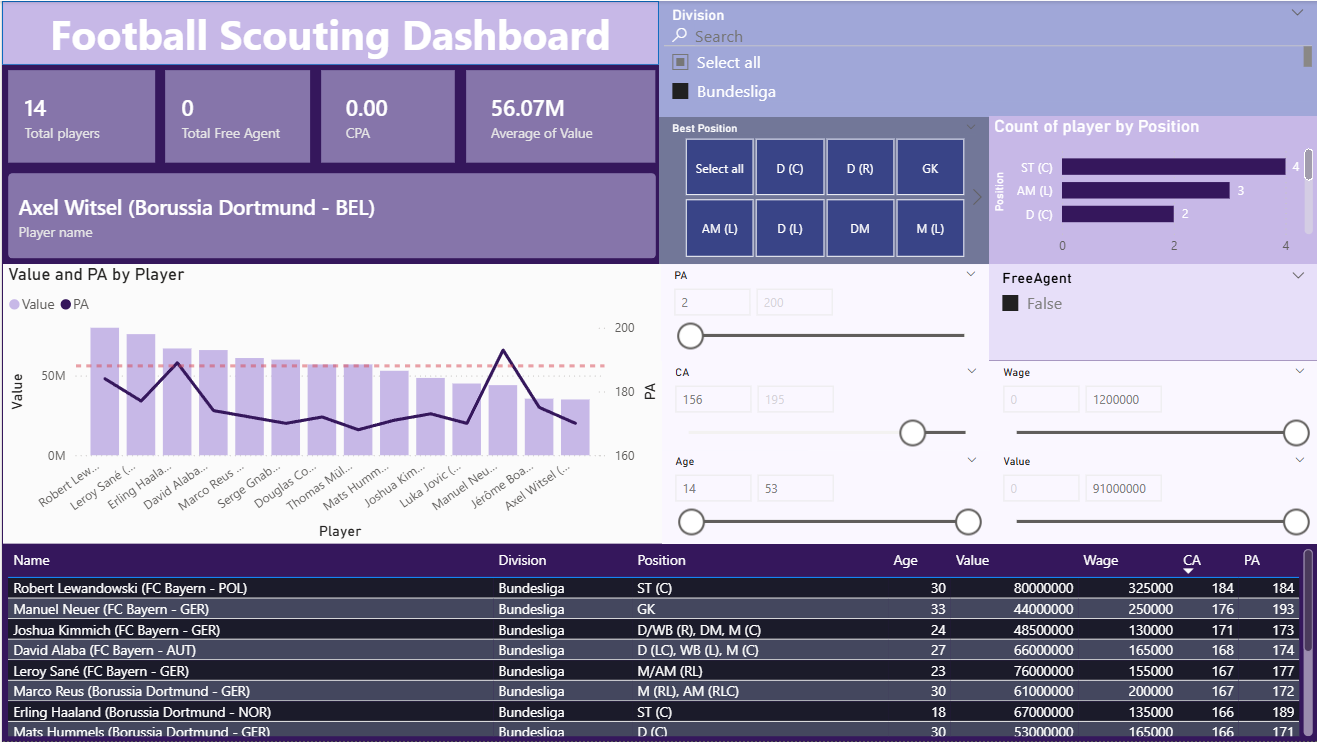
The Football Scouting Dashboard supports the prospect and value-for-money scenarios. It filters by division, best position, PA, CA, age, wage, value, and free-agent status, then connects the shortlist to player counts, average value, a Value-versus-PA view, and a Cost per Ability measure built from value, CA, and PA.
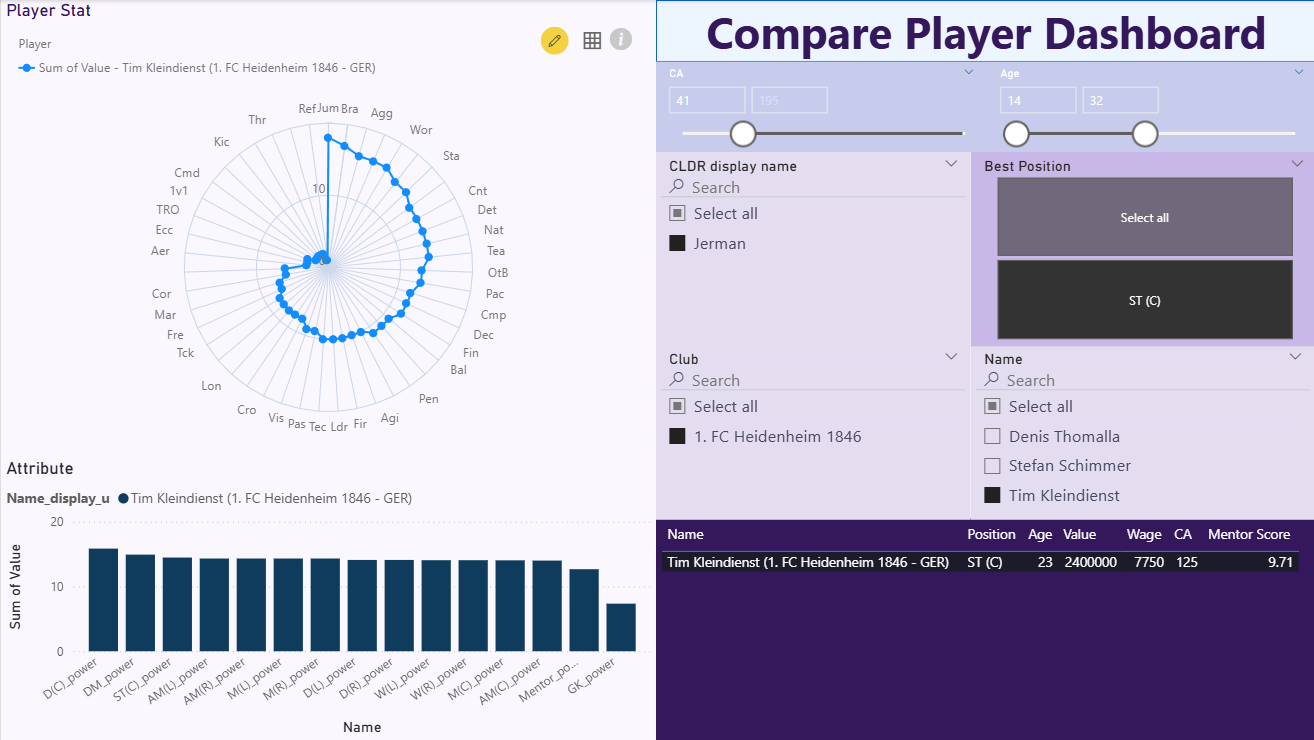
The Compare Player Dashboard supports mentor and replacement searches. A radar chart and attribute chart make player profiles comparable, while the table brings together position score, age, value, wage, CA, and Mentor Score. Filters for nationality, club, position, and name let the user move from a broad profile to specific players.
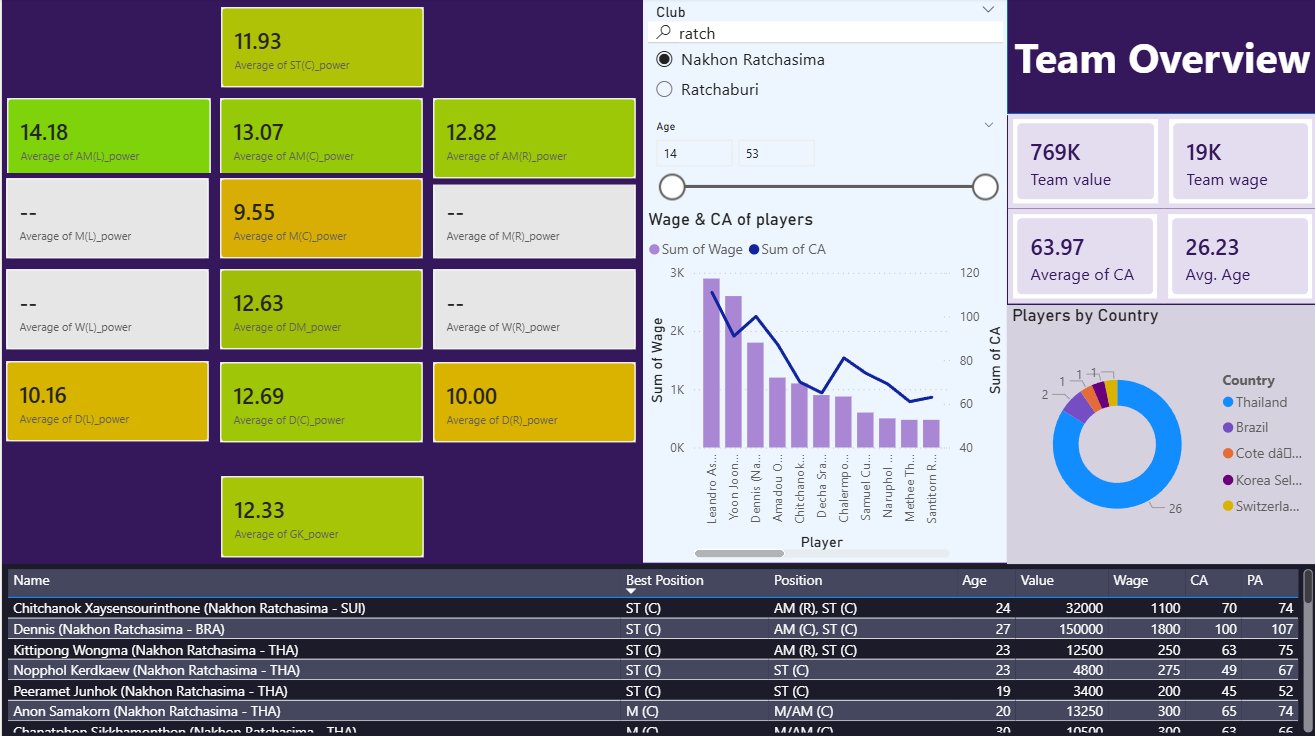
The Team Overview moves from individual recruitment to squad planning. It shows average power by position on a pitch, team value, weekly wage, average CA, average age, nationality mix, and the underlying player list so a director of football can inspect where a squad looks strong, thin, expensive, or unbalanced.
The Power BI report
The three submitted report pages move from a scouting pool, to individual comparison, to a team-level overview.
 View full size ↗
 View full size ↗
 View full size ↗
What I took from the project
The strongest lesson was that a dashboard becomes clearer when every page starts from a decision. The user scenarios determined which source fields we kept, which calculated fields we created, and why the report needed both individual-player and whole-team views.
I also learned to keep derived scores explainable. Position power and Mentor Score are useful ways to compare a large player pool, but they are assumptions created for this coursework. Showing the formula logic, filters, and underlying player rows makes those assumptions easier to question and refine.