Project journal
IM Impower Project
An eight-week internship spanning AI error analysis, existing application maintenance, API development, and an end-to-end clinic dashboard build and deployment.
- Where
- IM Impower Co., Ltd.
- Project period
- 1 June–31 July 2025
- My role
- Full-Stack Developer & Data Analyst Intern
Working across the system, not one isolated screen
My internship at IM Impower moved between data analysis and full-stack development. I began by learning how an existing AI-assisted clinic system, its database, and its price calculations worked. From there, I analyzed where outputs differed, maintained existing applications, created and corrected API behavior, and built a clinic dashboard across its frontend and backend.
The work was connected by one practical question: how does information travel from a model or database into something another person can review and use? Answering that meant understanding the data first, tracing problems through several layers, and testing the result again after it reached an interface.
How the eight weeks unfolded
Understand & measure
Study the clinic AI workflow and database, then prepare comparisons between AI, staff, and doctor-provided treatment prices.
Investigate & explain
Analyze missing and mismatched outputs, test image contrast, visualize error distributions, and present the findings to the client.
Build & release
Fix frontend and backend behavior, create API endpoints, build the Makalin Dashboard, and deploy through staging and production.
The internship, on one poster
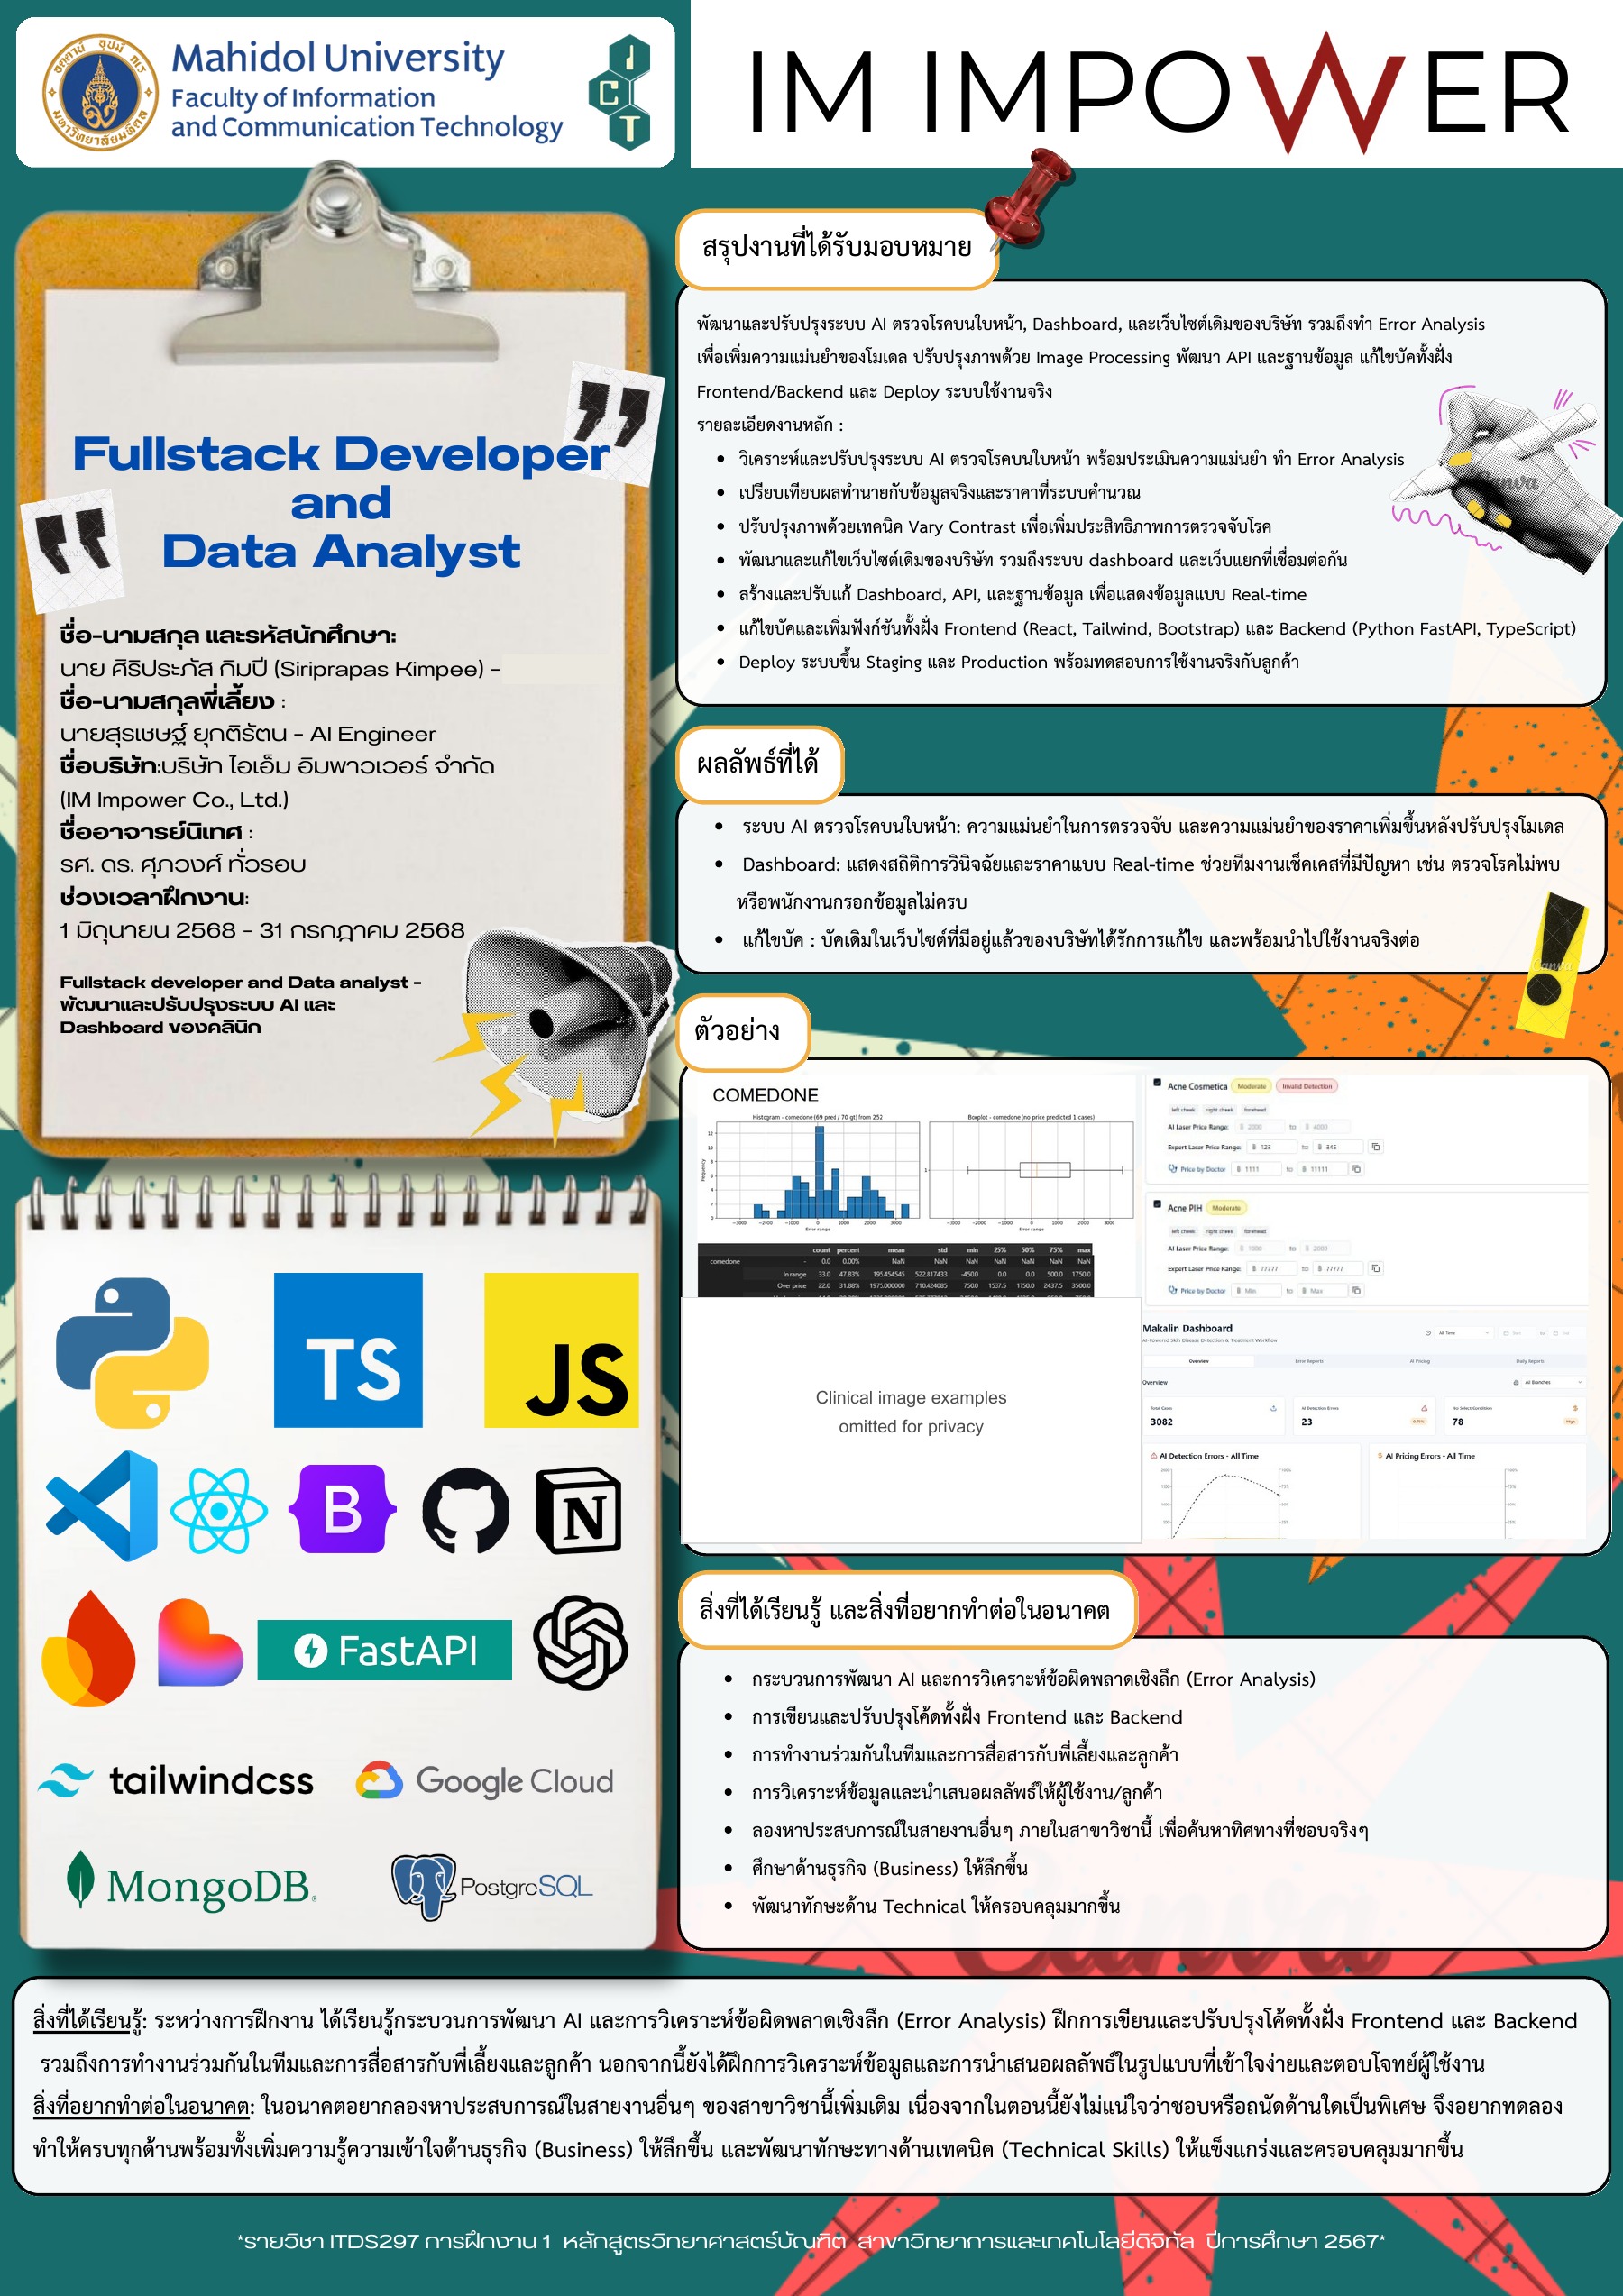
My original internship summary poster. This public version omits my student ID and the clinical face photographs; the work summary and other examples remain visible. Open the full-size image to read it.
 View full size ↗
Learning the system before changing it
During the first week I used the existing system and traced how disease detections, treatment prices, and clinic-entered information were stored. That gave me the context to query the database and prepare records for analysis without treating the model output as an isolated number.
In the following weeks I used Python to compare prices produced by the AI with values entered by clinic staff and reference values from doctors. I looked for missing conditions, price differences, and recurring patterns, then prepared trend views and summaries that made those discrepancies easier to discuss.
The dashboard work in context
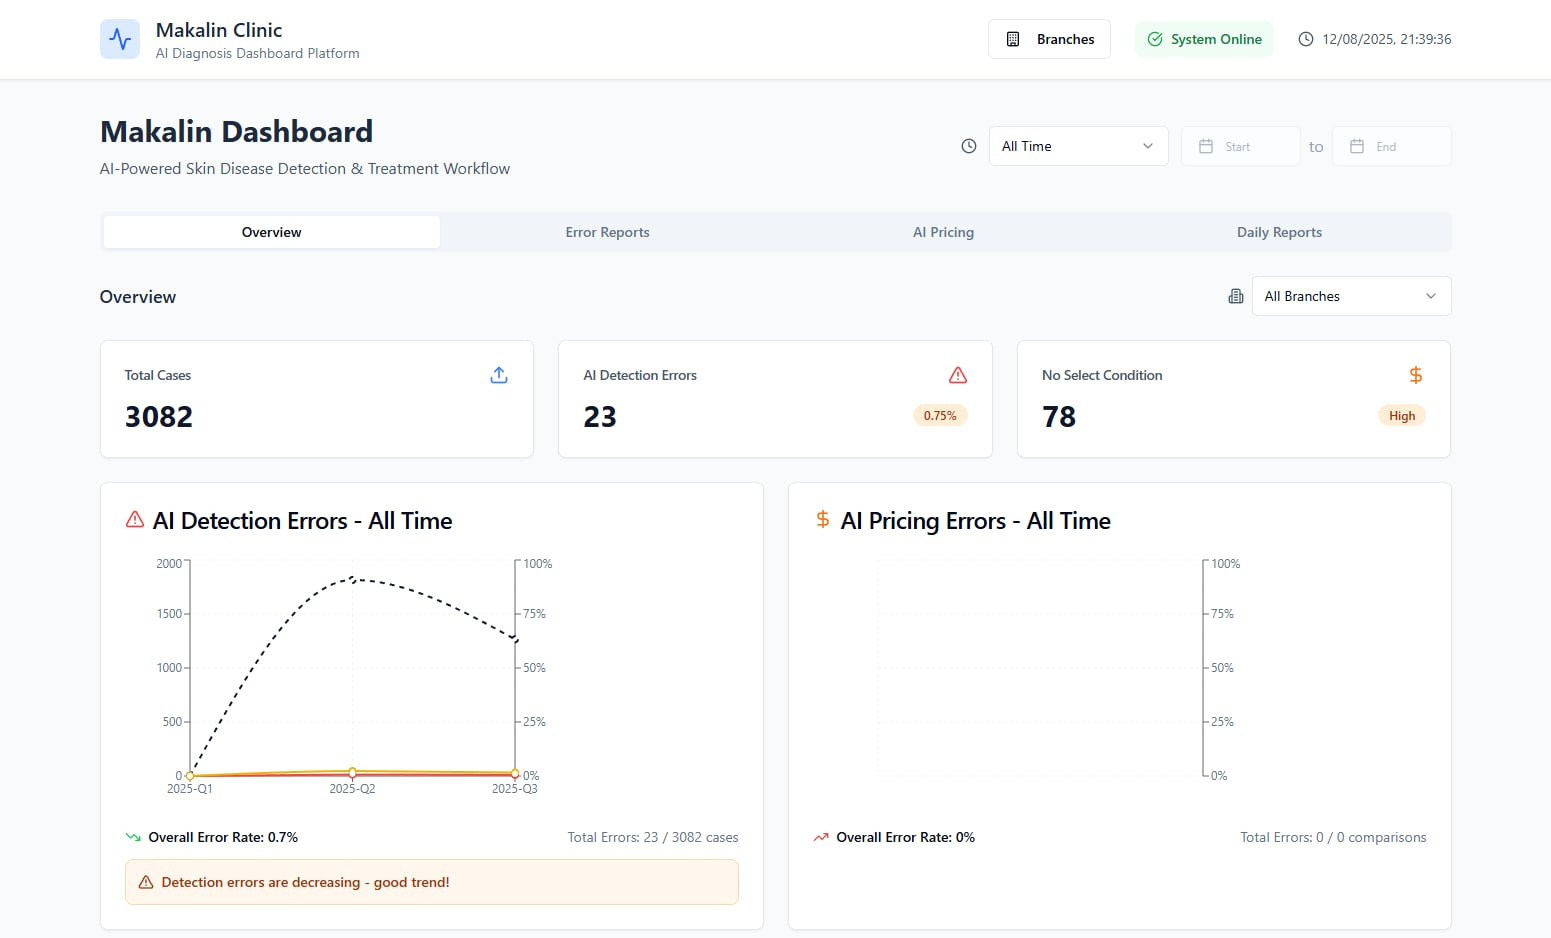
An aggregate screenshot from the internship material. The values are a recorded example rather than current operating figures or a model-accuracy claim.
 View full size ↗
Turning model outputs into an investigation
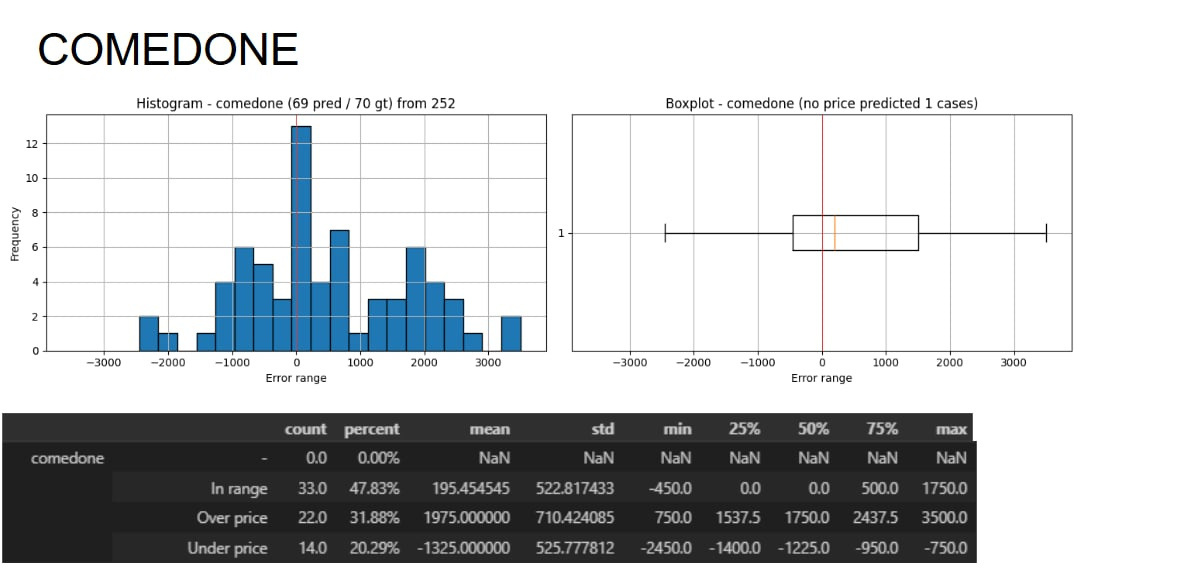
The analysis expanded from price comparisons into disease-specific error patterns. I used histograms, boxplots, summary tables, and statistical measures to inspect which groups were within range, over-priced, or under-priced. I also calculated per-condition summaries and used micro and macro averages while preparing the findings for a client presentation.
One experiment varied image contrast to see how preprocessing affected disease detection and the resulting price output, with particular attention to melasma. When prices were missing in the Docker-based run, I compared outputs stored in PKL and JSON files and studied more of the model code to narrow down where the behavior changed. These checks supported diagnosis and discussion; they were not a claim that I retrained or independently validated the medical model.
An example of the error analysis
The original chart and summary table from the internship presentation. This excerpt shows the analysis format and categories used for one slice of the work.
 View full size ↗
From investigation to application delivery
The second half of the internship shifted toward product work. On an existing TypeScript and Python dashboard, I studied the codebase, fixed frontend issues, corrected backend API behavior, and created a new endpoint when the existing data retrieval did not match what the interface needed. That work also required SQL for POST and UPDATE behavior and checking the data returned from the database.
I then maintained two connected clinic applications across React, Bootstrap, CSS, TypeScript, Python, and MongoDB. I added or hid interface elements, fixed frontend and backend bugs, deployed to staging for testing, and then released the approved changes to production through Firebase.
In the final week I built the Makalin Dashboard across its frontend and backend. I turned the requested reporting ideas into a project structure, identified the relevant database collections with guidance from my mentor, created the APIs, connected the returned data to the interface, and deployed the result using Firebase and Google Cloud. Moving between analysis, APIs, UI work, and release gave me a much clearer view of a system as one connected product.