Project journal
Practical DevOps
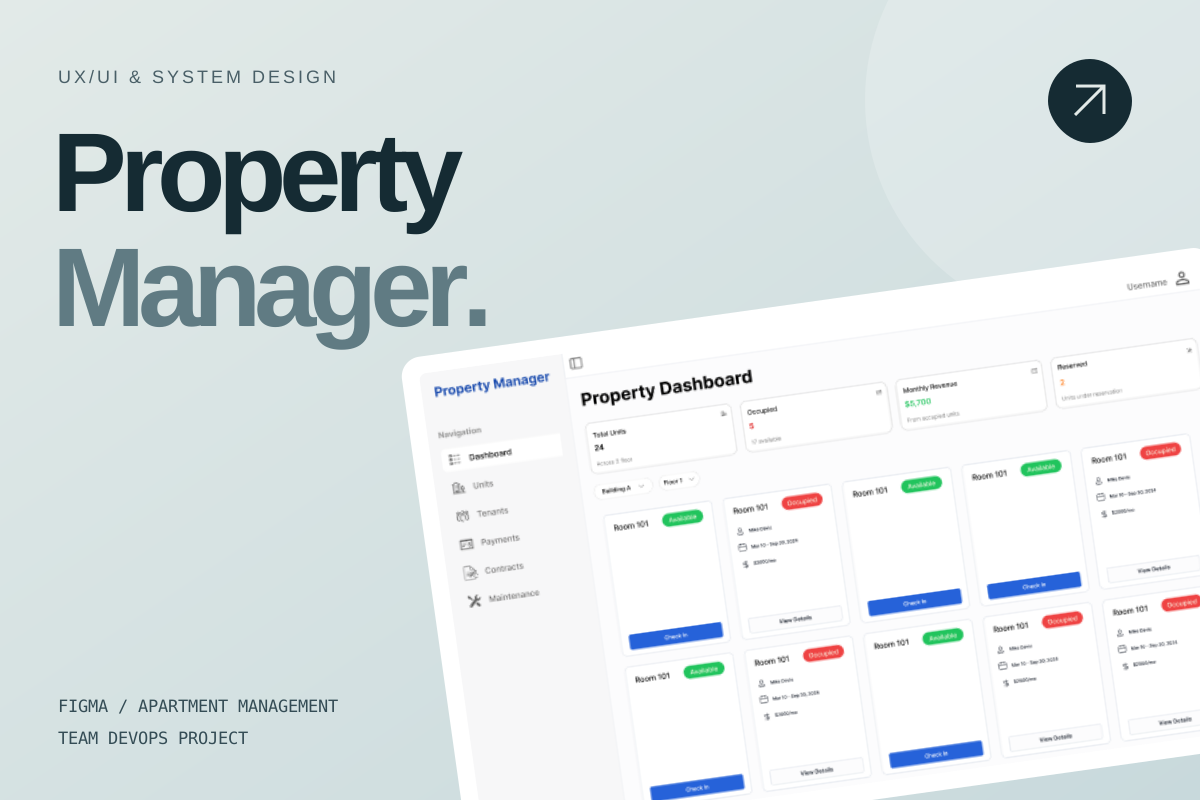
A team apartment-management project centered on my UX/UI work in Figma, with contributions to database design and defining API functions.
- Where
- Mahidol University · ITDS323
- Project period
- Course project
- My role
- UX/UI in Figma · contributed to database & API design
My contribution started with the interface
My main contribution to this Practical DevOps project was UX/UI design in Figma. The team built an apartment-management admin tool, which gave the design work a practical setting: helping someone keep track of rooms, tenants, payments, documents, and maintenance in the same system.
I also had the opportunity to contribute to the database design and help define the functions the API needed to provide. That brought me into conversations about the system behind the screens as well as the interface itself.
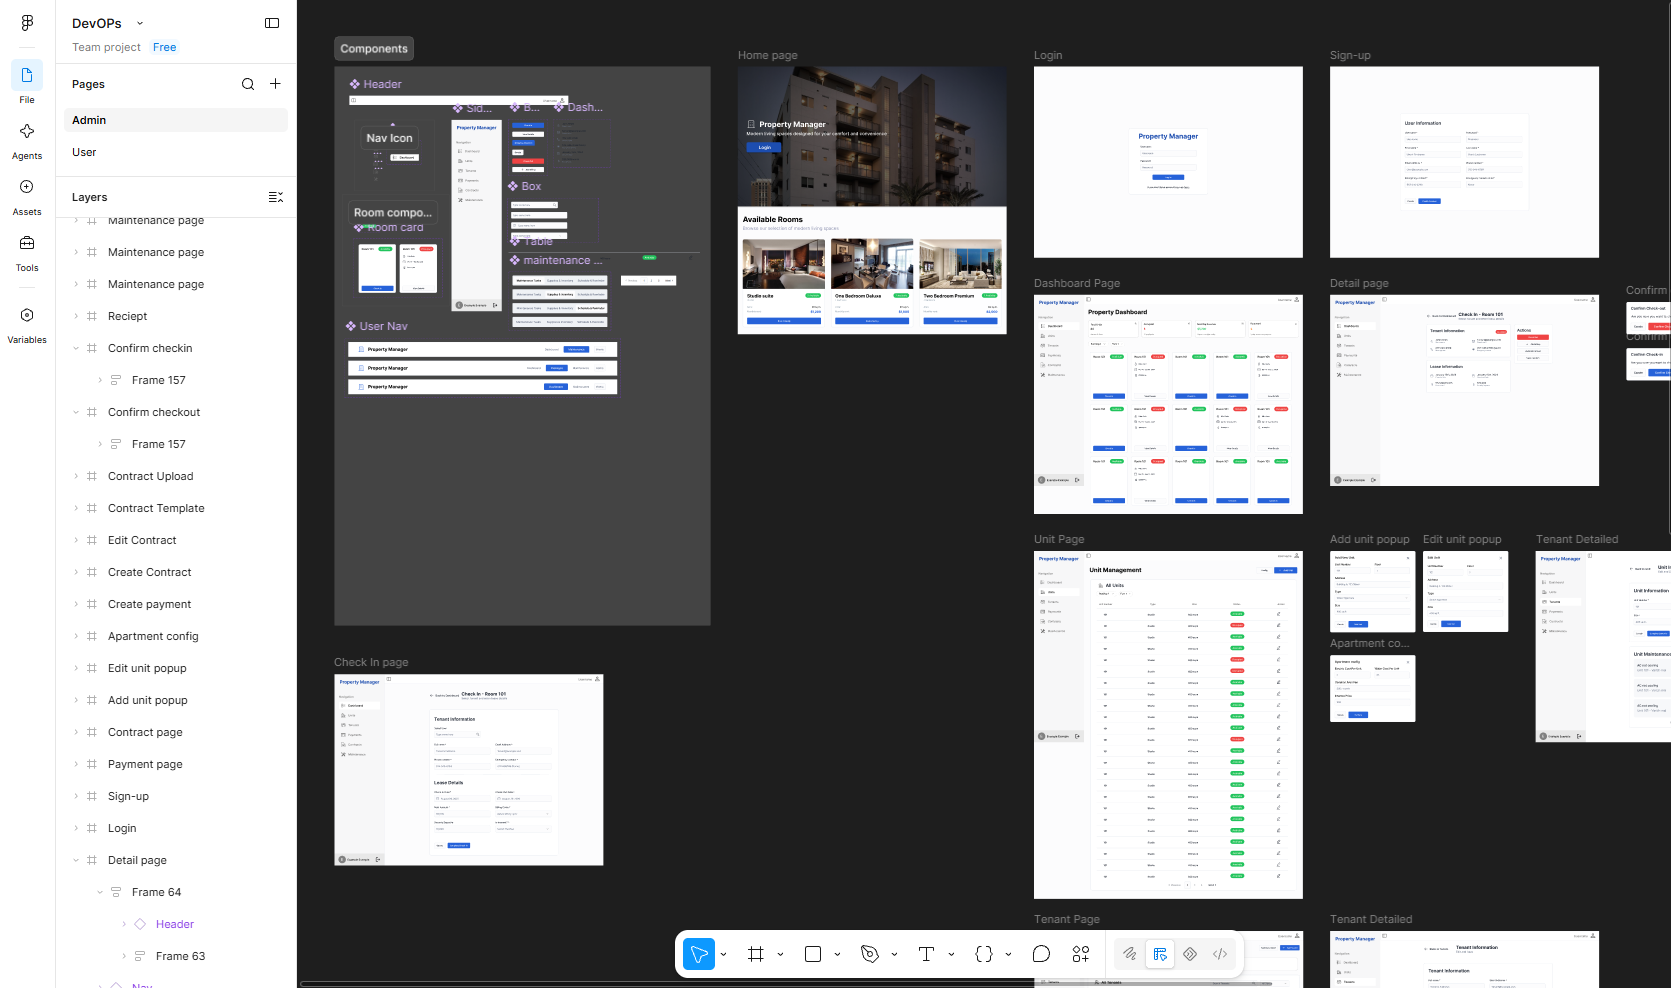
The Figma workspace below shows the design side of my contribution: reusable interface elements alongside the screens of the apartment-management system. I also learned about the work surrounding those interfaces, from task assignment to testing and delivery in the team project.
The design work, in Figma
A view of my apartment-management design workspace, shared here as the main visual artifact of my UX/UI contribution. Open the full-size image to explore the canvas.
 View full size ↗
Looking at the screens as a connected experience
The canvas brings header and navigation elements, room cards, forms, and tables together with the home page, account screens, dashboard, and administrative views. Seeing them alongside one another makes the design work easier to follow: the same system needs to support an overview of the building as well as the details of an individual room or tenant.
This is the part of the project I focused on in Figma. The design file is linked above, while the application examples later in this story provide the wider team context for how those requirements appeared in the running system.
A shared set of interface building blocks
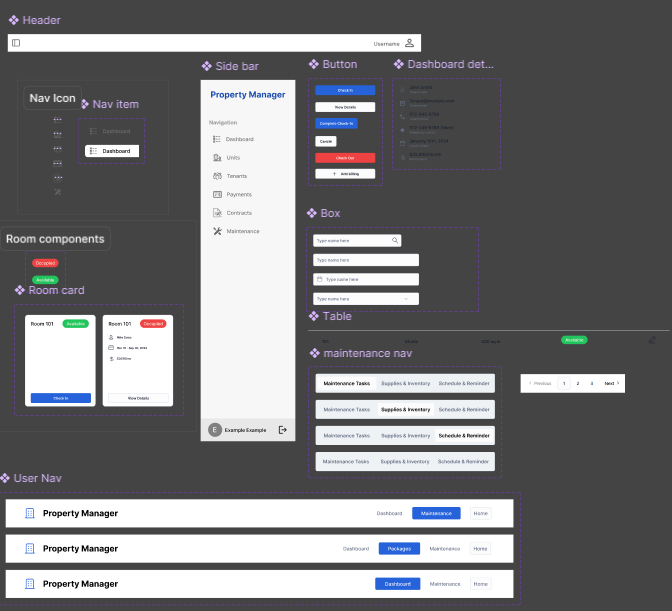
A closer view of the components in the Figma file. The examples include headers, navigation, room-card states, buttons, inputs, tables, and maintenance navigation.
 View full size ↗
From arriving at the site to managing the building
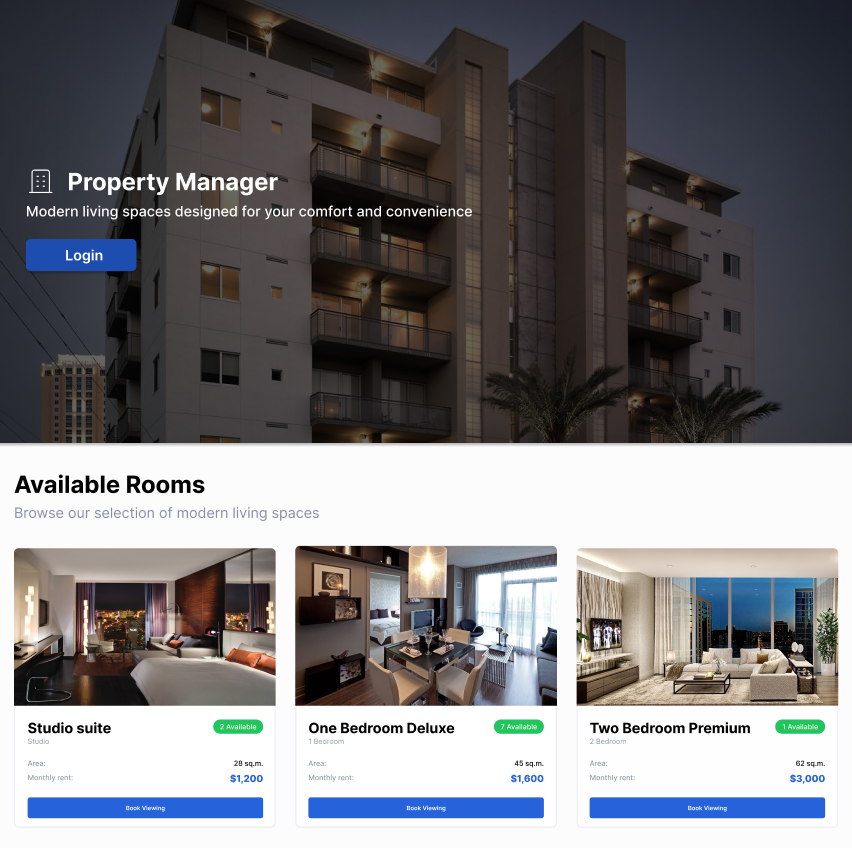
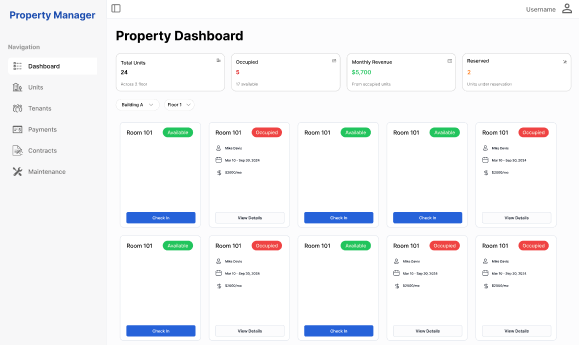
The home-page design introduces the property, presents available room types, and gives visitors a way to log in or start exploring a room. The admin dashboard has a different purpose: bringing room availability, occupancy states, and common room actions into a single overview.
The screens below show those two contexts. The room counts, names, dates, prices, and summary figures are design examples used to communicate the interface and its states.
Two views of the same property
Original screen designs shared from the Figma project, with sample content.
 View full size ↗
 View full size ↗
Connecting a list with the task behind it
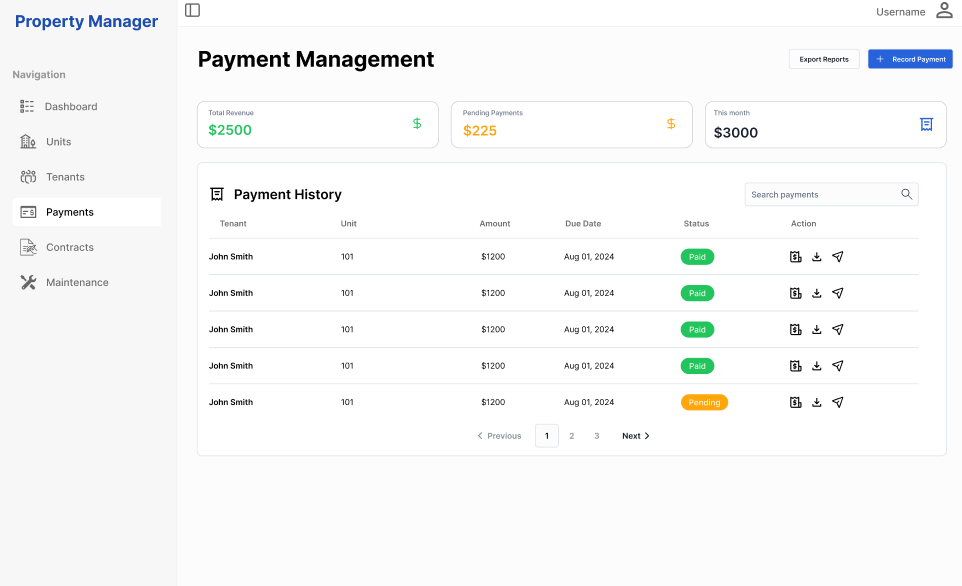
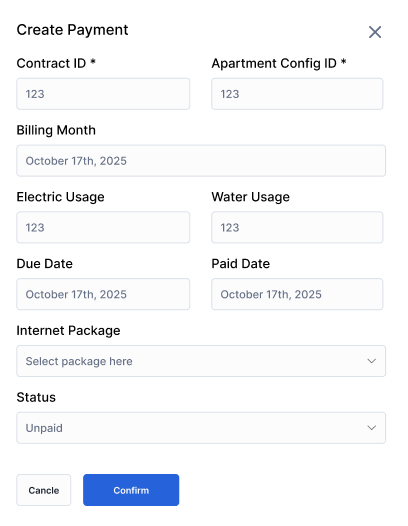
Payment management is another example of the overview-to-detail relationship. Its screen brings together summary figures, payment history, search, statuses, and actions. The Create Payment form then collects the information for one record: the contract, apartment configuration, billing month, utility usage, relevant dates, package, and payment status.
Alongside designing the interface, contributing to the database and API-function design helped me think through how information entered in a form relates to the data a list or dashboard needs to display. That connection between the screen, the stored information, and an API's responsibilities was an important part of the experience.
Payment overview and the create form
Design screens with placeholder records and figures. They illustrate the layout and workflow in Figma.
 View full size ↗
 View full size ↗
Understanding the work behind a room card
The initial brief called for an overview of 24 rooms across two floors. Behind that overview were tenant records, lease durations, room assignments, check-in and check-out dates, rent amounts, and billing cycles. Preventing conflicting occupancy was another core requirement. A room's availability therefore had to be understood in relation to its tenancy and dates.
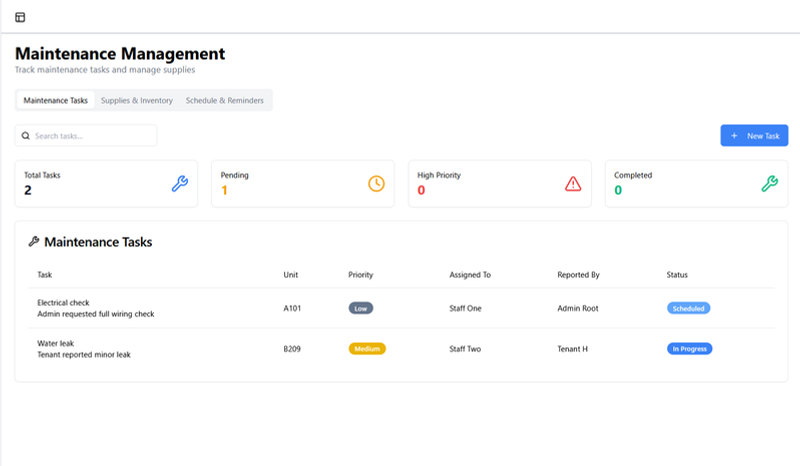
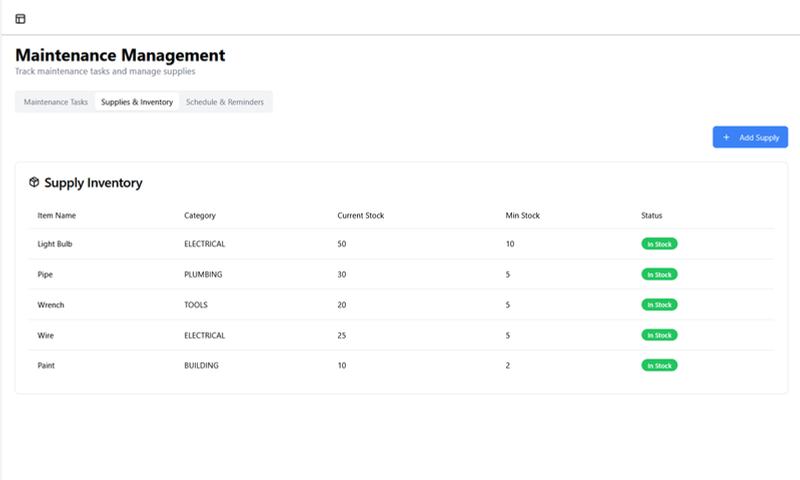
Other parts of the brief covered rent and utility receipts, rental contracts, maintenance logs, and recurring maintenance reminders. Thinking through those connections helped me understand the interface as a set of related administrative tasks, rather than a collection of separate forms.
A look inside the team application
Original application screenshots from the course presentation, shown as context for my UX/UI contribution in Figma. The labels and records shown are example interface data.
 View full size ↗
 View full size ↗
What changed as the requirements expanded
The presentation separates the initial brief from a second phase of requirements. One example was changing room rates while preserving the old rate in historical records. That is a small-sounding change with a visible consequence: the information shown for a previous month must still make sense after today's price changes.
The expanded brief also included CSV imports for water and electricity usage, usage graphs by room or floor, stock alerts, summary reports, and configurable room and floor counts. These examples made the relationship between interface choices and the underlying system easier for me to see. They are part of the documented project scope, with the presentation supplying demonstrations of the team application.
Learning how design fits into delivery
The team used Jira to assign work, and the presentation describes a React/TypeScript frontend, a Spring Boot API, and PostgreSQL. It also covers unit testing, Cypress end-to-end tests, Docker, GitHub Actions, and Kubernetes. That gave me a view of the technical work that sits around the interface I was focused on.
The documented GitHub Actions workflow runs on pull requests and pushes to main, runs Cypress checks, and then builds and publishes the frontend Docker image before triggering deployment. Learning about that sequence helped me connect a design contribution with the process the team used to test and deliver the application.